Previously this blog has covered why multiple experiments are often needed before we can feel confident in a finding. But how exactly are experiments made in the first place?
This article is a walkthrough of the basic steps common to almost every scientific experiment. There will be a lot of sidestepping of some issues to keep it simple, but feel free to look those sore spots up!
Not all scientific research involves experiments of course. Plenty of scientists work with archival experimental data – data that have been collected by researchers in the past (data is actually plural, the singular is datum!). Many areas of science use techniques that don’t involve experiments at all, like zoology field work where scientists just watch how animals behave.
For now though, let’s just think about the parts of science that do use experiments.
What is an experiment anyway?
A traditional view of an experiment would require a few different parts to be present. There needs to be an idea that is being investigated, this is the theory. Then this needs to be made into a more specific question, the hypothesis. From this, a particular method is chosen. Once the method has been completed there will be results, which are largely just numbers. These are interpreted into the conclusions, also called the discussion section.
In order to keep this relatively simple, we’re going to use a fairly basic experiment. All these points apply equally well to more complicated experiments though. Those just tend to be hidden behind a few layers of jargon!
The Theory
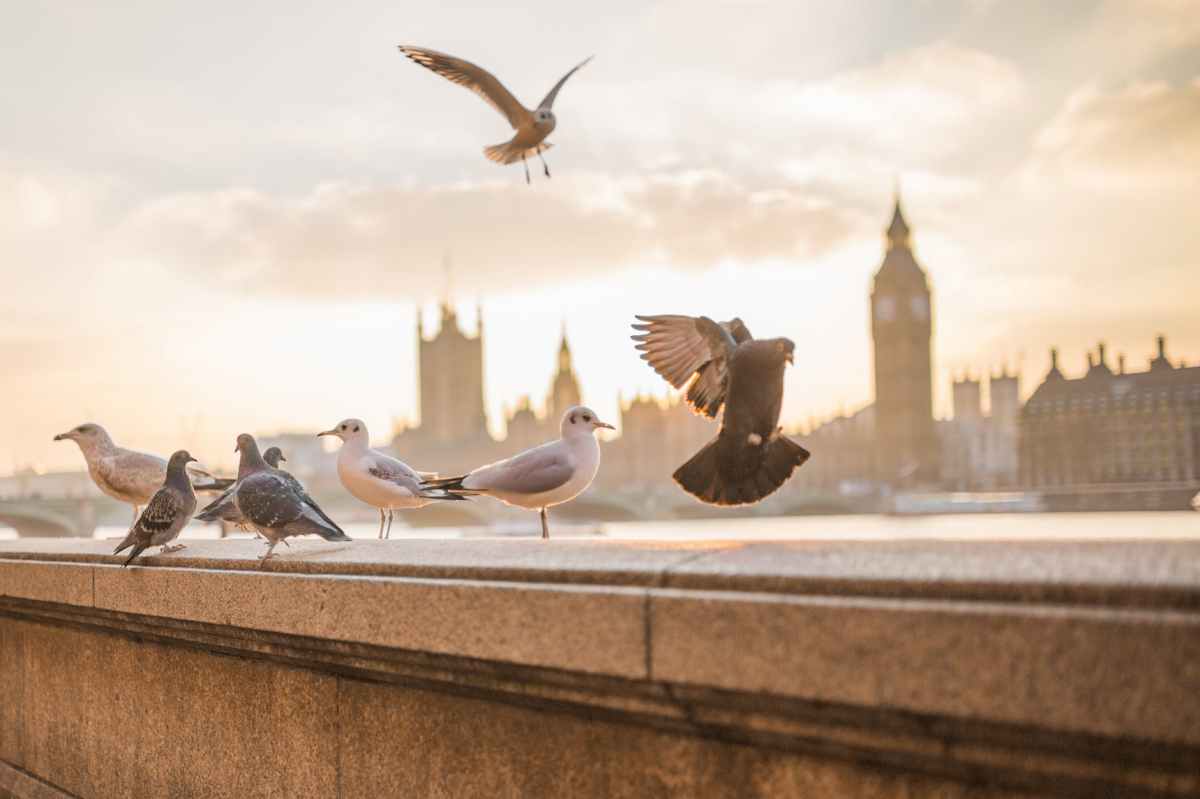
Suppose I have a simple idea I want to find out more about – what kind of seeds different types of birds prefer. I’m not an avian nutritionist so I don’t have any pre-conceived notions about the eating habits of different birds, I just want to know about what seeds to use for the birds I am likely to see in my garden.
Here we have a basis for a theory. Birds like seeds, but they may not all like the same seeds the same amount. This is a good theory because it is falsifiable. This means that we can find evidence against it.
A theory being falsifiable is very important for science. This is where a lot of confusion often comes in. For example, if I tell you that I have a invisible unicorn that lives with me but you can’t touch him or sense him in any way – that’s not falsifiable. You can’t prove that it isn’t true, so its not a good theory.
If you came to my flat and noticed a sad looking donkey with a carrot on his head, you might be able to prove I was wrong about owning a unicorn. That’s falsifiable. And cruel.
The Hypothesis
Once we have a theory we need to consider what exactly we are going to test. This can be tricky, because most theories contain a lot of questions.
In general, most hypotheses make very simple predictions that are easy to test. Sometimes there are multiple hypotheses in a single experiment, and often these overlap, but for now let’s just consider one hypothesis.
Strictly speaking there are two hypotheses for every one hypothesis, as it were. An experimental hypothesis is the one that we are more interested in. It might predict that there will be some change that occurs, or a difference between two groups, or that two things will be related in some way.
(It is possible for an experimental hypothesis to be that some things are all the same, this is called equivalence testing, but that’s a matter for another time.)
The other hypothesis we need to have is called the null hypothesis. This is the prediction that the thing you are looking for isn’t true. We need a null hypothesis because that is our baseline. Traditionally, when doing an experiment, we are trying to see if the null hypothesis isn’t true. This is different from testing if our experimental hypothesis is true.
This distinction can be a little tricky, but it helps to think of it like this:
If we think that all swans are white, this is very difficult to prove as being true. We would have to find all the swans in the world, make note of the colour of their feathers, jot it all down, and ensure that they were all similarly plumed. If we wanted to disprove this, we just have to find one black swan. (For a more indepth look at this particular idea, see The Black Swan: The Impact of the Highly Improbable by Nassim Nicholas Taleb.)
So what should our experimental and null hypotheses be? They need to be fairly simple, so lets reduce the number of birds we are looking at to just the most common ones. Around where I live that’s pigeons and seagulls. Feel free to substitute your own birds though, I won’t mind.
Experimental hypothesis: Pigeons and seagulls will prefer different types of seeds.
Null hypothesis: Pigeons and seagulls will not differ in seed preference.
The Method
We have a theory, from which we have generated some hypotheses. Now comes the really tricky part.
The method is where everything can go terribly terribly wrong. A fantastic idea for an experiment, lumbered with a faulty method, can end up with you having little more than a bunch of useless numbers and a heap of wasted time.
The main things to keep in mind are your variables, how you operationalise them (we’ll get to that, don’t worry), and how you measure them.
Variables and Operationalisation
Selecting the right variables is quite easy if you have a simple hypothesis. There are two types of variable in this experiment, the independent and the dependent variable. If we were doing a different experiment we would use different variables, but these are the right ones for this type.
The independent variable is the thing or things that we are changing, or the thing that is different to start with. We can’t change a pigeon into a seagull or vice versa (nor should we even if we could!), so this is already set for us.
To operationalise this, we have to make this variable into something we can measure. Here it is simple – we will consider all types of pigeons to just be ‘pigeons’ and all types of seagulls to just be ‘seagulls’. Apologies to any twitchers out there, but we aren’t too fussed about species and subspecies.
We also have a second independent variable, which is the seed type. Our seeds are either nyjer seeds or sunflower seeds in this case.
The dependent variable is the one that we expect to change based on our independent variable. We are looking at seed preference so this is going to be how much of each seed type each bird eats.
We will operationalise this as the amount of nyjer seeds and sunflower seeds eaten per bird in one sitting.
Measuring our Variables
We need to make sure that we have an accurate track of what birds have eaten what. So in our imaginary scenario why don’t we use some high-resolution cameras and a set of custom build bird feeders. Each bird feeder can accommodate one bird at a time and has two bowls, each filled with a different seed.
In the real world this would be very tricky. Often in science this is why experiments are conducted in the lab, where we have more control. We could then bring in pigeons and seagulls one by one and let them eat. The downside is that this is not super realistic, but no experiment is perfect so we will have to make do – even in our imaginations!
We will use the cameras to track what birds use the feeders and what seeds they eat, and we will do this for one week.
Ready? Let’s go!
… and we’re done. My that was easy, wasn’t it? The power of the imagination!
The Results
We have a big ol’ dataset now. It’s got rows and columns and ID tags, and everything else fancy we could want. But we have to get usable data out of it, so we need to know what we are looking for.
We have lots of information about what times of day birds visited, and for how long, and whether they alternated seed, and so on and so forth. For our hypotheses though all we want to know is how much of the two seeds each bird ate.
All that other data needn’t go to waste though! We can use it for other experiments in future if we wanted to, and we can share it with other people who might want to know more themselves. Using repositories like the Open Science Framework we can share our data with people all over the world. Or we could if it wasn’t imaginary, but ho hum.
Descriptive Statistics (aka graphs and tables)
Knowing what variables we want, we can create a giant spreadsheet with three columns – Bird Type, Nyjer Seed Eaten, and Sunflower Seed Eaten.
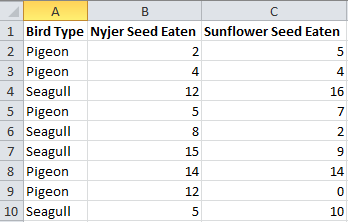
In here we put all the data we want to look at. But it is very stuffy just looking at data like this, so we can put it into a nice graph instead. This will let us see what our data look like roughly, although we can’t use it for actual analysis.

Looks pretty good to me. We haven’t got anything that looks too out of the ordinary. If we had one column that was negative then we might think something had gone wrong with counting (it being unlikely that a bird would regurgitate seeds into the bowl and thus leave it with more than it took!).
Quite often in science we do actually do a lot of legwork just looking at graphs and tables to see the basic patterns. Science is often more art than science, you see. There are various smaller tests we can do to make sure everything is normal, but the eye is often the best way.
Inferential Statistics (aka the actual tests)
To actually analyse our data we need to perform some kind of tests. There are dozens of different tests that we could use, but to keep it simple we will use an ANOVA. You don’t need to understand the specifics fortunately, in fact this is something that is not typically taught in undergraduate degrees until late in the first year.
The gist behind this test is that it looks at whether sets of data are similar or not. If they are sufficiently dissimilar, then it gives us a significant finding. This means that it is very unlikely that our findings would have happened by chance.
In contrast, a nonsignificant finding means that our results are likely to have been by chance. Just a fluke of the data, or natural variation.
We will get a bunch of arcane looking numbers out of this test, but an ANOVA (like all similar tests) boils down to one number, the p value.
This number is the probability of the finding we got (or one more extreme) happening if there was no difference between the groups. We want this number to be less than 0.05, which means that less than 1 time in 20 we would get this finding if there was really no difference.
(A lot of people debate about whether 0.05 is a sensible number or not, but again that’s something for another time.)
Lets say that our finding is less than 0.05, hurrah it’s significant! We think that it likely that our results did not happen by chance.
Digging deeper we see that there is no significant difference in seed type preference for pigeons, but that there is a significant difference for seagulls. Before we go any further in working out what this means, we need to move on to the Conclusions.
The Conclusions (or Discussion)
We have a significant finding, yay!
We have found evidence that suggests (never proves, always suggests) that different birds have different seed preferences.
In fact, we have found something called an interaction. This means that our two independent variables (bird type and seed type) affect each other when it comes to our dependent variable, seed preference.
This means that we can’t predict how much seed a bird will eat just from their species, or the type of seed alone. We need to know both things to make a good prediction.
A pigeon will like both types of seed equally well, because we didn’t find a significant difference between the seed consumptions for pigeons. A seagull will prefer the nyjer seeds to the sunflower seeds, as we did find a significant difference between the seed consumptions for seagulls.
In the conclusions section we can begin to speculate about why it is that we got the findings we got. Maybe it’s seed size, and seagulls like bigger seeds like sunflower seeds but pigeons don’t care about size (good for them). Maybe pigeons are not smart enough to tell the difference between seeds, but seagulls can.
There are any number of reasons we could come up with. The important thing is that we can back up these reasons with evidence from our own experiment, or from work done by other people.
Typically the author of a paper will also take the opportunity here to critique their own work. They might mention how a particular method could be improved based on their findings, or talk about how this finding does or doesn’t fit with known theories.
This is good because it recognises that no experiment is perfect, and it also gives opportunities for other people to explore this area further.
Sometimes a paper will end with a statement that makes the experiment relevant to the real world. Perhaps we might want to use this new finding to change what bird seed we buy. If we wanted fewer seagulls then, based on our findings, we should put out less nyjer seed and more sunflower seeds – as seagulls like this less.
Is that it?
Yes broadly speaking. That is the basic framework of a scientific experiment. One type, anyway.
To hideously paraphrase Forrest Gump, experiments are like a box of chocolates. They come in all shapes and sizes, use many different methods, and you never know what you are going to get when you open them.
Scientists can spend all day playing around with different methods, seeing what works and what doesn’t. There might be some hot new bit of code floating around Twitter that promises gold. Or, there might be some ancient analysis levered out of the pages of a dusty tome at the back of a professor’s shelf.
However, no matter what the shape or size, almost every experiment will have the elements that we have covered above.
A theory it wants to examine. A hypothesis specific to the experiment. A method to test the hypothesis, and results from that test. And finally a section interpreting what it all means and tying it into a neat bow. Or at least a bow with fewer loose bits.
Experiments can seem arcane and mysterious if you don’t understand them. This can have the downside of it being easy to fool people with bad experiments. Sometimes good experiments get used for bad purpose too, or other interested parties twist the findings to suit their needs.
If you are aware of how an experiment is made though, you stand more of a fighting chance in spotting these problems. Maybe there are even some experiments of your own you could do to try to solve them.
At the very least, you might end up keeping the local birdlife amused for a while.
NB. No pigeons, seagulls, bird seed, or high speed cameras were harmed in the making of this article.
